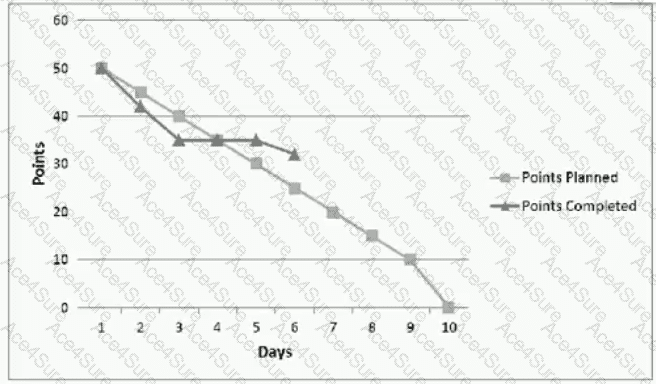
Analyzing the burndown chart, we see:
Points Planned (gray squares): decreasing steadily from 50 to 0 over 10 days (ideal burn).
Points Completed (gray triangles): plateau between days 3–6, lagging significantly behind planned completion.
This indicates that the team is behind schedule, and unless they accelerate, they may fail to complete all committed work.
According to the PMI Agile Practice Guide (Section 5.4: Burndown Charts) and Mike Griffiths’ PMI-ACP Exam Prep Book (Chapter 6: Monitoring Progress), such divergence between the ideal and actual burn lines indicates that the iteration is at risk.
Option A is correct: the iteration is in jeopardy due to lack of progress mid-sprint.
Option B is incorrect—scope removal would show a downward shift in planned points.
Option C is false—the team is behind, not ahead.
Option D is misleading—velocity appears inconsistent (e.g., plateau from day 3–6).