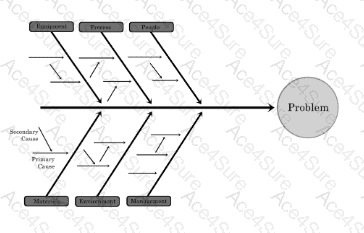
According to the PMBOK® Guide, the Ishikawa diagram (also known as a cause-and-effect, fishbone, or root-cause diagram) is a key tool used within the Quality Management knowledge area. Specifically, it is most frequently utilized during the Control Quality process.
Control Quality: This process involves monitoring and recording the results of executing quality activities to assess performance and ensure the project outputs are complete, correct, and meet customer expectations. When a defect or a performance issue is identified, the Ishikawa diagram is used to break down the potential causes of that specific problem into categories (such as Manpower, Methods, Machinery, Materials, Media, and Management) to find the root cause.
Root Cause Analysis: The diagram helps the project team look beyond the symptoms of a problem to identify the underlying reason why the problem occurred, which is a primary objective of the Control Quality process to prevent future occurrences.
Analysis of other options:
A. Plan Quality Management: While you might define which tools you will use during this planning phase, the actual act of using the diagram to analyze a specific problem happens during execution and monitoring.
C. Risk Management: Although root cause analysis is used in Identify Risks, the Ishikawa diagram is most formally associated with the quality tools and techniques defined by PMI.
D. Plan Scope Management: This process focuses on defining how the scope will be defined, validated, and controlled; it does not typically involve cause-and-effect modeling for defects.
In summary, per PMI standards, the Ishikawa diagram is a diagnostic tool used in Control Quality to link the observed effect (the problem) to its potential causes.

