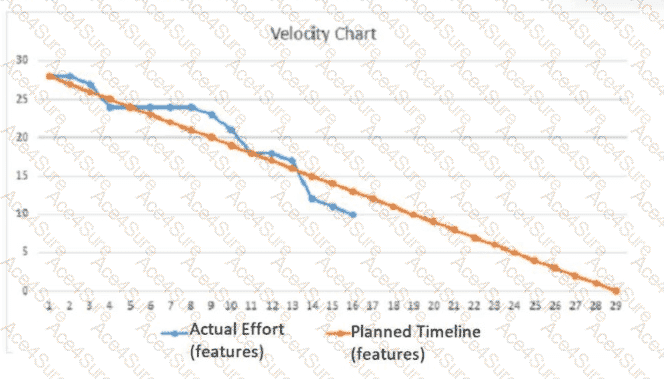
Which of the following can a project manager infer from the following velocity chart?
A.
The project is on schedule.
B.
The project Is ahead of schedule.
C.
The project is behind schedule.
D.
The project is at risk.
The Answer Is:
C
This question includes an explanation.
Explanation:
The velocity chart typically shows the amount of work completed over time. If the “Actual Effort” line is below the “Planned Timeline,” it indicates that the project is not progressing as fast as planned, hence it is behind schedule. This is inferred by comparing the actual work completed against what was scheduled.
References = The answer is based on standard project management practices and the typical interpretation of velocity charts in project management. For detailed information, please refer to the CompTIA Project+ Study Guide and other official CompTIA resources.
PK0-005 PDF/Engine
Printable Format
Value of Money
100% Pass Assurance
Verified Answers
Researched by Industry Experts
Based on Real Exams Scenarios
100% Real Questions
Get 65% Discount on All Products,
Use Coupon: "ac4s65"