Google LookML-Developer Question Answer
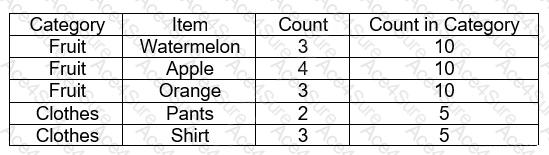
A developer wants tocreate a measure that shows the item count broken out by category. When a second, more granular dimension is added to the same query, the count broken out by category should still represent the original aggregation and be duplicated on each line. The business wants this “count” in “category” available in the Explore section without any additional work done by the end user. For example:
The Count column represents the count for each combination of Category and Item.
The Count in Category column represents the count for each Category only.
How can the developer address this need with a LookML object?
LookML-Developer PDF/Engine
- Printable Format
- Value of Money
- 100% Pass Assurance
- Verified Answers
- Researched by Industry Experts
- Based on Real Exams Scenarios
- 100% Real Questions

Get 65% Discount on All Products,
Use Coupon: "ac4s65"
