Admission Tests GMAT Question Answer
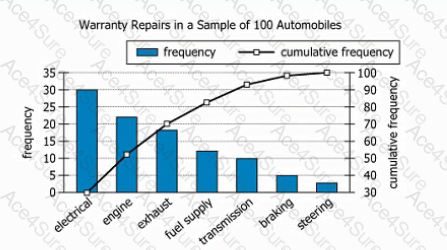
The graph summarizes data on a sample of 100 automobiles requiring warranty service within one year of purchase. Each automobile required service in exactly one of seven categories. For each category, the frequency\& the number of automobiles in the sample requiring service in that category; the cumulative frequency\s the total number of automobiles in (he sample requiring service in that category or in any of the categories to the left in the graph. In the graph, the frequency scale is on the left and the cumulative frequency scale is on the right.
From each drop-down menu, select the option that creates the most accurate statement based on the information provided.

GMAT PDF/Engine
- Printable Format
- Value of Money
- 100% Pass Assurance
- Verified Answers
- Researched by Industry Experts
- Based on Real Exams Scenarios
- 100% Real Questions

Get 65% Discount on All Products,
Use Coupon: "ac4s65"
