Admission Tests GMAT Question Answer
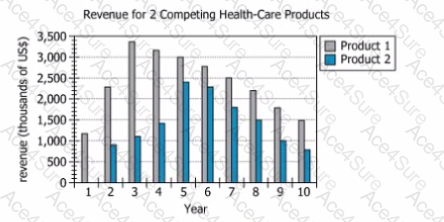
The graph shows the total annual revenue. In US dollars (US$), from sales of each of 2 competing health-care products for 10 consecutive years. Product 1 was first sold In Year 1, and Product 2 was first sold ki Year 2.
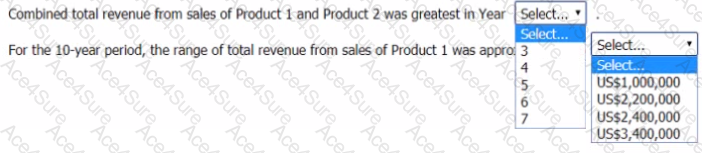
From each drop-down menu, select the option that creates the most accurate statement based on the information provided.

GMAT PDF/Engine
- Printable Format
- Value of Money
- 100% Pass Assurance
- Verified Answers
- Researched by Industry Experts
- Based on Real Exams Scenarios
- 100% Real Questions

Get 65% Discount on All Products,
Use Coupon: "ac4s65"
