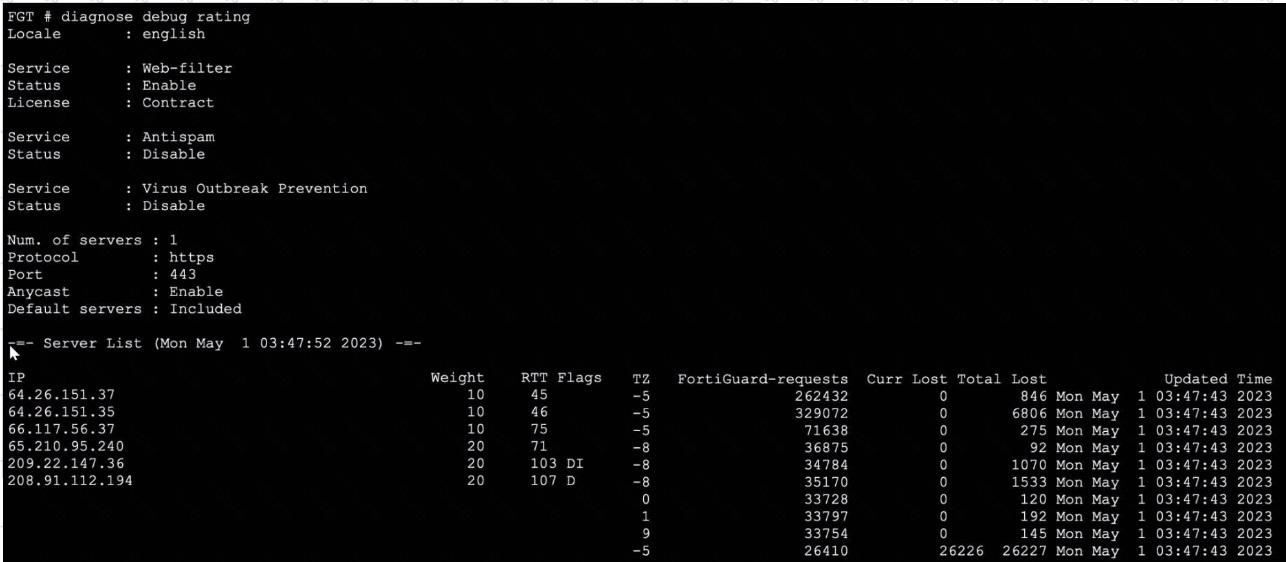
The exhibit displays the output from the diagnose debug rating command on a FortiGate device. This command is used to display information about FortiGuard Web Filtering or other security-related queries performed by FortiGate to FortiGuard servers. Official Fortinet documentation outlines the meaning of each field in the server list. The FortiGate maintains a list of available FortiGuard servers, selecting the optimal server based on factors such as weight, round-trip time (RTT), and regional settings.
The very first entry in the server list after "Server List" is the server FortiGate initially uses, prioritized by factors such as proximity and RTT. Here, 64.26.151.37 is listed first, and the FortiGuard-requests value confirms that this server handled the highest number of requests.
The IPs, weights, and lost/failed counters are monitored for server performance and selection over time. FortiGate's default operational logic is to try the first entry for contract validation and use the next in the list if the first is unavailable or has high latency or packet loss.
There is no direct correlation between the Weight and the number of FortiGuard-requests. The servers with higher or lower weights may still handle different request volumes based on availability and performance.
The TZ (time zone) value's sign (positive or negative) does not affect server preference; it is informational, showing the server's location relative to UTC, not a rating metric.
DNS query results for FortiGuard servers are not shown here, and the provided servers are not returned in DNS query order.
This command and interpretation are detailed in the FortiOS Administration Guide’s section describing FortiGuard server selection and contract validation processes.
[References:, , FortiOS Administration Guide: FortiGuard Service Connectivity and Debugging, , Official Technical Notes on diagnose debug rating output structure]