CompTIA DY0-001 Question Answer
A data scientist is using the following confusion matrix to assess model performance:
Actually Fails
Actually Succeeds
Predicted to Fail
80%
20%
Predicted to Succeed
15%
85%
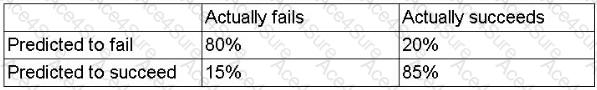
The model is predicting whether a delivery truck will be able to make 200 scheduled delivery stops.
Every time the model is correct, the company saves 1 hour in planning and scheduling.
Every time the model is wrong, the company loses 4 hours of delivery time.
Which of the following is the net model impact for the company?
DY0-001 PDF/Engine
- Printable Format
- Value of Money
- 100% Pass Assurance
- Verified Answers
- Researched by Industry Experts
- Based on Real Exams Scenarios
- 100% Real Questions

Get 65% Discount on All Products,
Use Coupon: "ac4s65"
