Databricks Databricks-Certified-Professional-Data-Scientist Question Answer
Refer to Exhibit
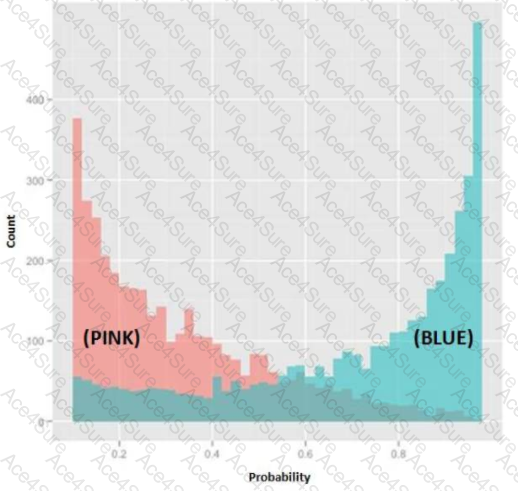
In the exhibit, the x-axis represents the derived probability of a borrower defaulting on a loan. Also in the exhibit, the pink represents borrowers that are known to have not defaulted on their loan, and the blue represents borrowers that are known to have defaulted on their loan. Which analytical method could produce the probabilities needed to build this exhibit?
Databricks-Certified-Professional-Data-Scientist PDF/Engine
- Printable Format
- Value of Money
- 100% Pass Assurance
- Verified Answers
- Researched by Industry Experts
- Based on Real Exams Scenarios
- 100% Real Questions

Get 65% Discount on All Products,
Use Coupon: "ac4s65"
