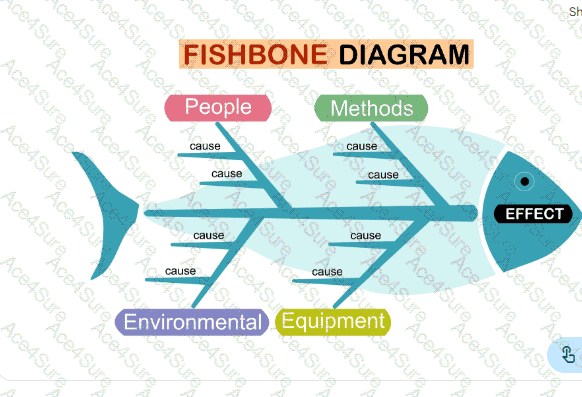
According to the PMBOKĀ® Guide, the Ishikawa diagram is a fundamental tool used in the Plan Quality Management and Control Quality processes. It is most commonly referred to by two other names:
Cause and Effect Diagram: Because it maps out various factors (causes) that contribute to a specific problem or quality defect (the effect).
Fishbone Diagram: Because the completed diagram resembles the skeleton of a fish, with the " head " representing the problem statement and the " bones " representing the categories of potential causes.
Analysis of Other Options:
B. Control chart: A graphic display of process data over time and against established control limits, used to determine if a process is stable.
C. Flowchart: A graphical representation of a process showing the relationship between steps. It is used to identify where quality problems might occur.
D. Histogram: A vertical bar chart showing the frequency of occurrence of data points, used to illustrate the central tendency and dispersion of a data set.
CAPM PDF/Engine
Printable Format
Value of Money
100% Pass Assurance
Verified Answers
Researched by Industry Experts
Based on Real Exams Scenarios
100% Real Questions
Get 65% Discount on All Products,
Use Coupon: "ac4s65"