WGU Applied-Algebra Question Answer
The graphed function n(t)represents the number of people, n, at a park thours after 8:00 a.m. The plotted points Aand Bhave coordinates (2│110)and (6│182).
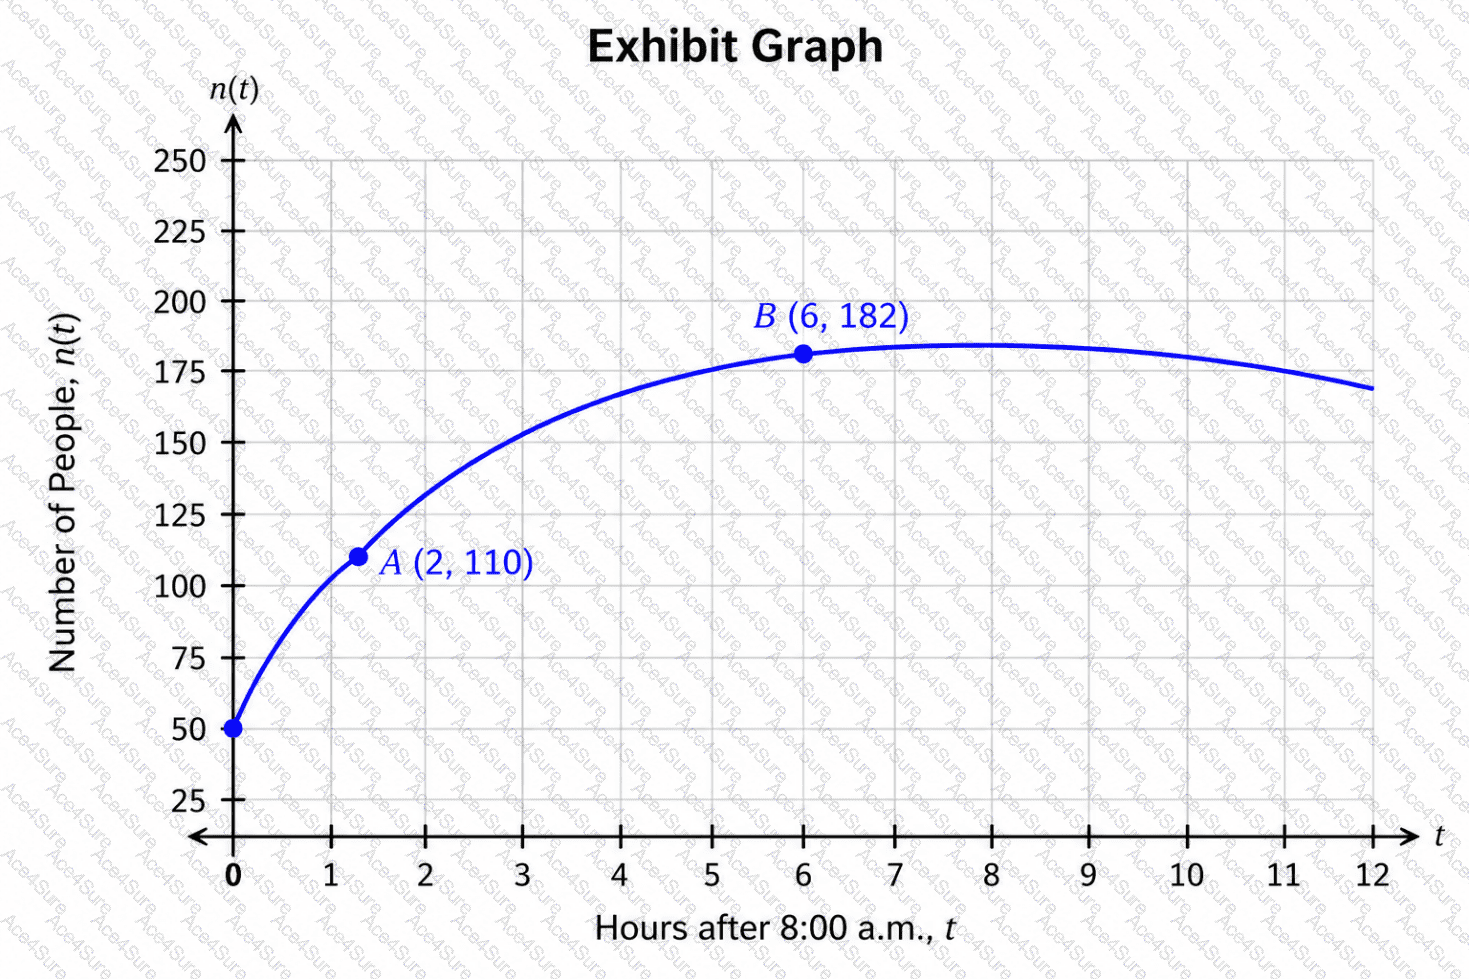
Which statement gives the correct interpretation of the average rate of change of the number of people over the interval from point Ato point B?
Applied-Algebra PDF/Engine
- Printable Format
- Value of Money
- 100% Pass Assurance
- Verified Answers
- Researched by Industry Experts
- Based on Real Exams Scenarios
- 100% Real Questions

Get 65% Discount on All Products,
Use Coupon: "ac4s65"