WGU Applied-Algebra Question Answer
The figure shows the graph of x(t), which represents the number of users, x, watching a live video thours after 9:00 a.m.
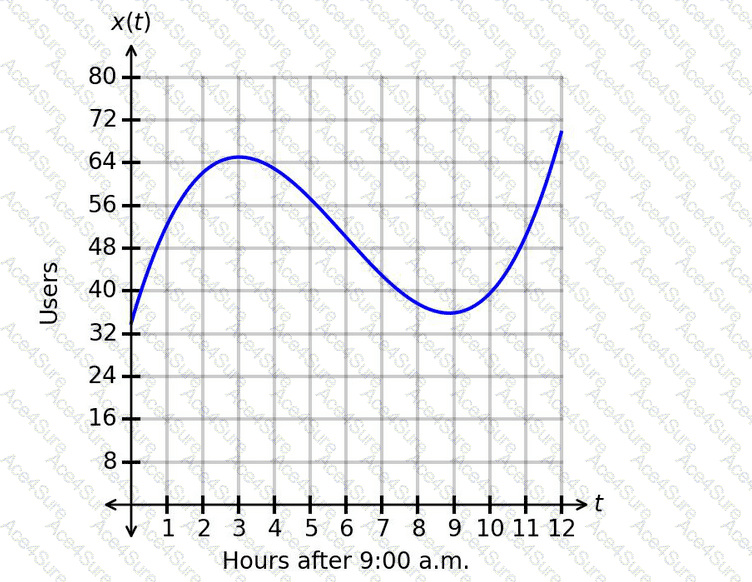
Which interpretation of the concavity between t=3.2and t=5.7is correct?
Applied-Algebra PDF/Engine
- Printable Format
- Value of Money
- 100% Pass Assurance
- Verified Answers
- Researched by Industry Experts
- Based on Real Exams Scenarios
- 100% Real Questions

Get 65% Discount on All Products,
Use Coupon: "ac4s65"
