Summer Sale Special Limited Time 65% Discount Offer - Ends in 0d 00h 00m 00s - Coupon code: ac4s65

The figure displays the graphs of two functions representing the heights, h_1and h_2, in feet,...

The figure displays the graphs of two functions representing the heights, h_1and h_2, in feet, of two balls tseconds after being launched.
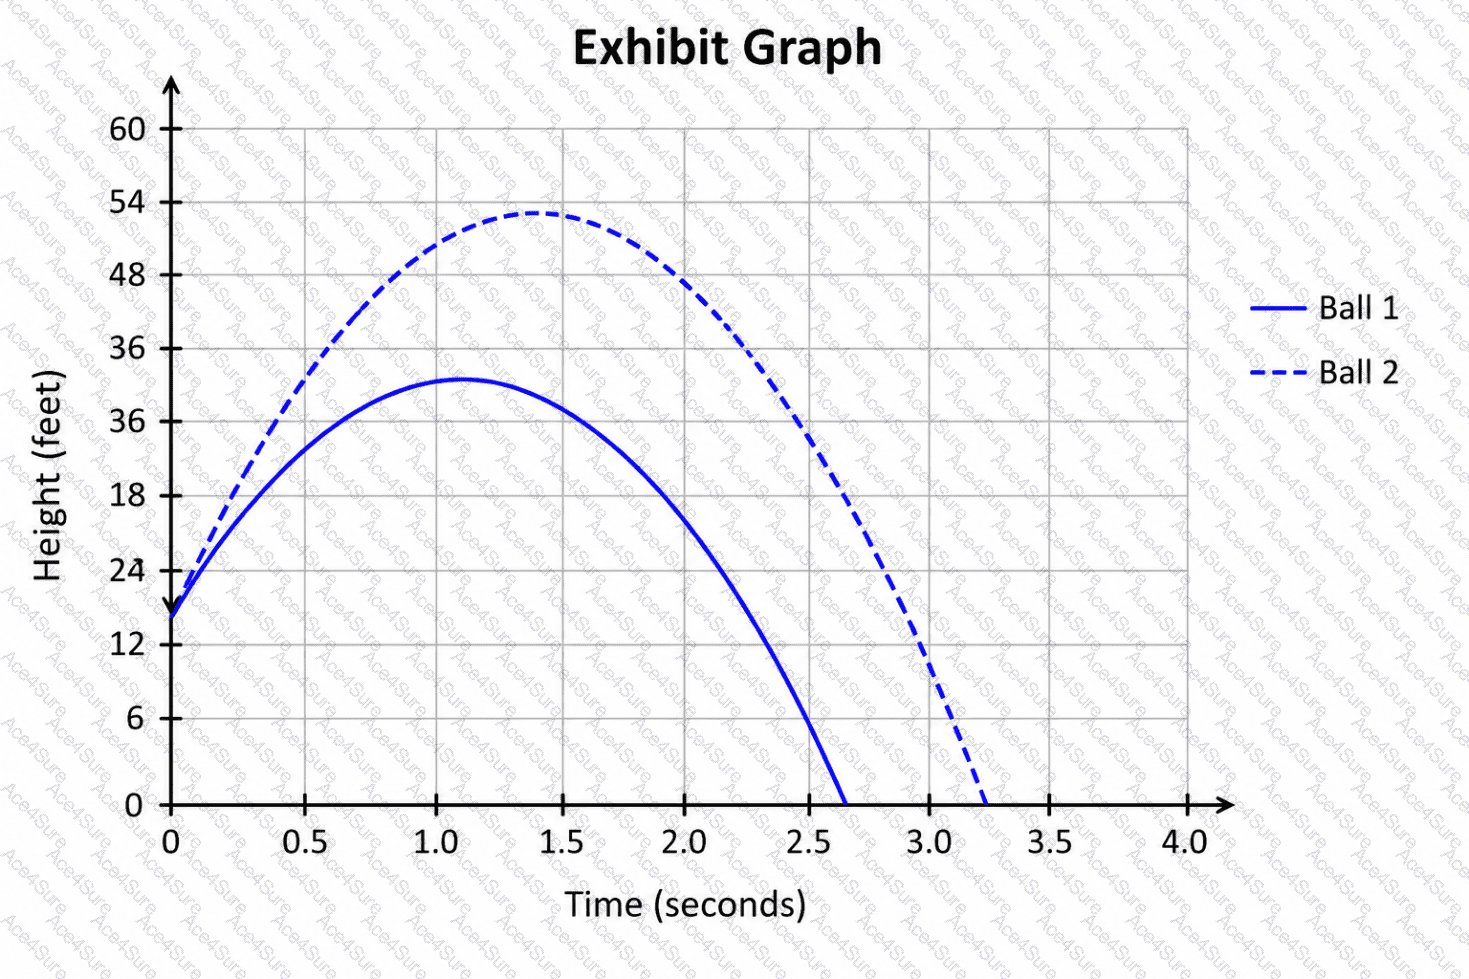
Which ball was lower 0.9seconds after being launched?

A.

Ball 1, because the height of ball 1 is less than the height of ball 2 at t=0.9.

B.

Ball 1, because the height of ball 2 is less than the height of ball 1 at t=0.9.

C.

Ball 2, because the height of ball 1 is less than the height of ball 2 at t=0.9.

D.

Ball 2, because the height of ball 2 is less than the height of ball 1 at t=0.9.

Applied-Algebra PDF/Engine
  • Printable Format
  • Value of Money
  • 100% Pass Assurance
  • Verified Answers
  • Researched by Industry Experts
  • Based on Real Exams Scenarios
  • 100% Real Questions
buy now Applied-Algebra pdf
Get 65% Discount on All Products, Use Coupon: "ac4s65"