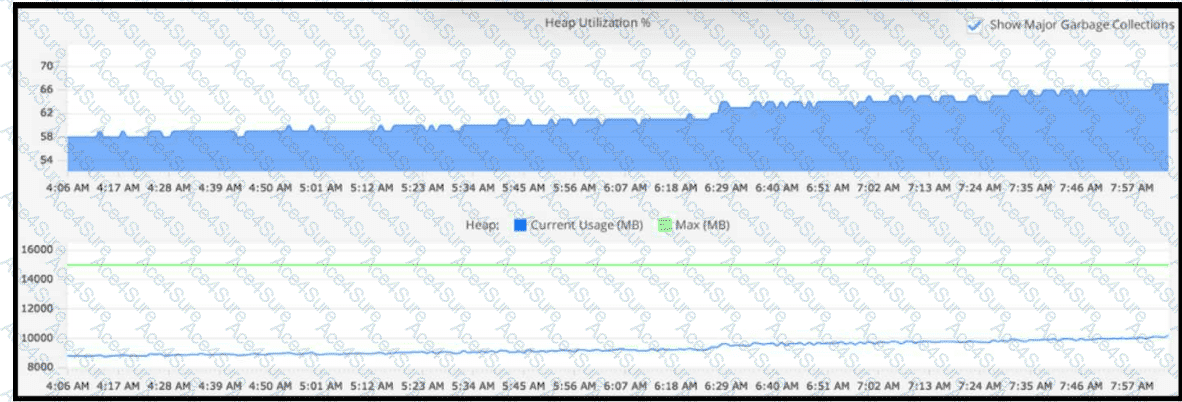
The Tiers and Nodes > Memory tab provides the appropriate JVM-level view for confirming suspected heap growth over a selected timeframe. The analyst should compare Heap Utilization (%) with Heap Current Usage (MB) versus Max (MB) and observe the effect of major garbage-collection events.
A potential memory leak is indicated when heap usage rises progressively and fails to return to a stable lower level after garbage collection. The important pattern is not simply high memory utilization, but an increasing post-garbage-collection baseline over time. The exhibit shows current heap usage gradually increasing relative to the maximum heap allocation, which warrants further memory diagnostics.
Hardware-resource memory metrics represent operating-system memory and do not isolate JVM heap behavior. Swap usage can indicate host memory pressure but cannot confirm an application heap leak. JMX metrics may expose heap values, but the dedicated Memory tab provides the quickest correlated visualization for heap utilization, maximum heap, current usage, and garbage collection.
Relevant CAAPA topics include JVM Memory Monitoring, Heap Utilization, Garbage Collection, Tiers and Nodes Memory View, Memory Leak Detection, and Object Instance Tracking.